Spam complaint rate 2026: the 0.3% operator playbook
Spam complaint rate in 2026: the 0.3% threshold explained, why ESP dashboards underreport, the five drivers of complaints, and the recovery playbook.
Spam complaint rate is the single most-cited email deliverability metric in 2026, and the most consistently misunderstood. Gmail and Yahoo enforce a 0.3 percent threshold under their February 2024 bulk sender requirements; Microsoft adopted equivalent standards on May 5, 2025, for any domain sending 5,000 or more messages per day; and best-in-class senders sit at 0.01 to 0.05 percent. Yet most teams measuring their spam complaint rate are looking at the wrong number entirely. The denominator your ESP shows in its dashboard (complaints divided by total sent) is not the denominator Gmail uses to evaluate you (complaints divided by emails delivered to the inbox). The gap between those two numbers is where every silent deliverability disaster we have seen on the audits we run has been hiding.
This is the operator playbook for spam complaint rate in 2026. It covers how the metric is actually calculated by the mailbox providers, the denominator trick that makes ESP dashboards underreport real complaint rates, the five thresholds that matter (0.08, 0.1, 0.3, 0.5, and per-campaign spikes), where to actually measure it (Google Postmaster Tools, Microsoft SNDS, Yahoo CFL), the five drivers that produce complaints, and the recovery playbook when you find yourself over the threshold. Written for SDRs, marketing operators, and deliverability owners who need to understand what the number means before they try to fix it.
For the broader foundation, see the email deliverability pillar, the sender reputation guide, and the email deliverability monitoring vs warmup guide. For the recovery side when complaints have already damaged reputation, see the email blacklist removal guide and the DMARC monitoring guide.
What spam complaint rate actually is
Spam complaint rate is the percentage of recipients who marked your message as spam, calculated against the population that actually received your message in their inbox. When a recipient clicks “Report Spam,” “Mark as Junk,” or moves your email from inbox to spam folder, that action is a complaint. Mailbox providers track these actions per sending domain and per sending IP, then use the aggregated rate as a primary input to your sender reputation.
The formula every mailbox provider uses:
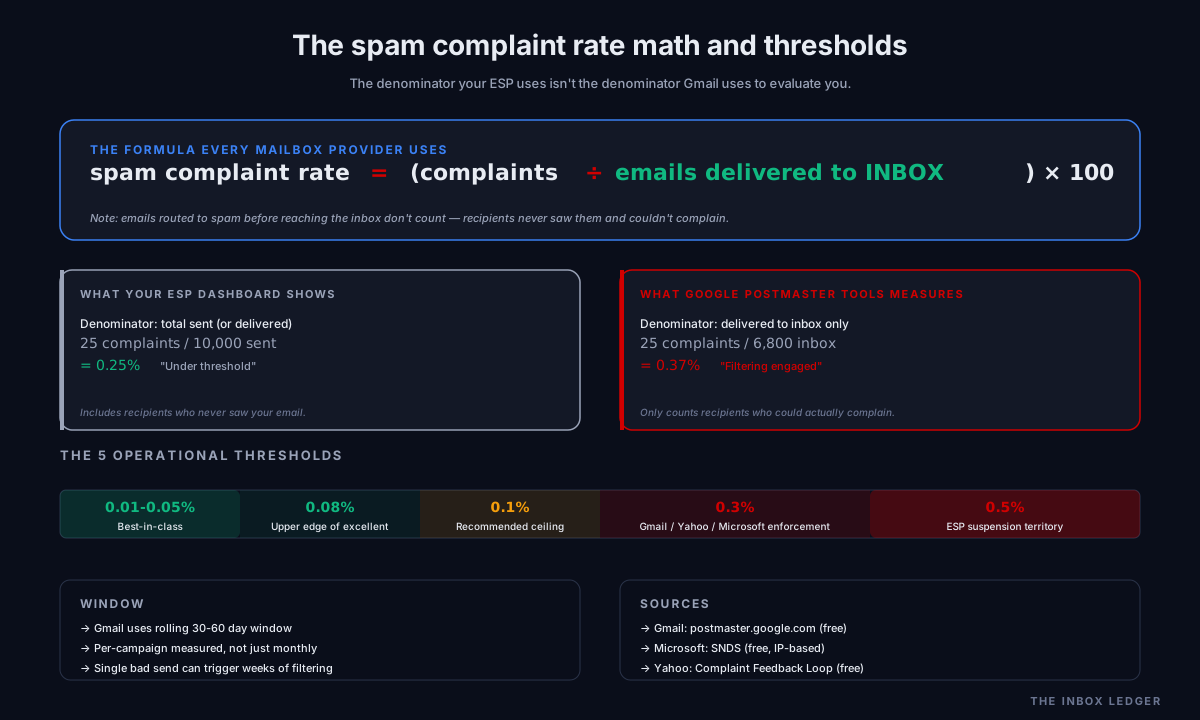
spam complaint rate = (spam complaints / emails delivered to inbox) × 100The numerator is straightforward: count the spam reports. The denominator is where most teams get the math wrong, because three different things look like they belong there:
- Total sent (what your ESP usually shows): every message your sending system attempted, including bounces and messages filtered to spam before reaching the inbox
- Delivered: every message the receiving server accepted, including those filtered to spam after acceptance
- Delivered to inbox: only messages that reached the recipient’s primary inbox, where the recipient could actually see them and choose to complain
Gmail, Yahoo, and Microsoft all use the third number, “delivered to inbox,” as their denominator. Their reasoning is direct: recipients who never saw your message in their inbox could not have complained about it, so they should not be in the denominator. This is the correct measurement from the provider’s perspective and the source of the denominator trick that ESP dashboards consistently get wrong.
The denominator trick that makes ESP dashboards lie
Here is the math problem in concrete terms. You send 10,000 emails to Gmail. Your ESP dashboard shows:
- 10,000 total sent
- 9,800 delivered (200 hard bounces)
- 25 spam complaints
- Reported spam complaint rate: 25 / 10,000 = 0.25 percent
You are under the 0.3 percent threshold. Looks fine.
What Gmail actually sees:
- Of the 9,800 delivered, Gmail’s filters routed 3,000 directly to spam (you never saw this in your dashboard)
- 6,800 actually reached the inbox
- 25 complaints from the 6,800 inbox recipients
- Gmail’s spam complaint rate: 25 / 6,800 = 0.37 percent
You are over Gmail’s threshold and your domain reputation is dropping, while your dashboard tells you everything is fine. This is not a hypothetical edge case; it is the most common reporting gap we see on the audits we run. ESP dashboards optimize for the numbers the ESP has, not the numbers Google uses to evaluate you.
The fix is checking Google Postmaster Tools directly. The “User-reported spam rate” panel in Postmaster Tools shows the actual rate Google calculates against actual inbox delivery, which is the only number that matters for Gmail filtering decisions. Microsoft SNDS provides similar visibility for Outlook and Hotmail; Yahoo’s Complaint Feedback Loop sends individual complaint notifications you can aggregate yourself.
The five complaint rate thresholds that matter
There are not just two thresholds (0.1 and 0.3) but five operational ones that produce different responses from mailbox providers:
0.01 to 0.05 percent: best-in-class territory. Healthy lists with strong relevance and clean acquisition. Gmail and Yahoo treat these senders preferentially; reputation builds upward from here.
0.08 percent: the upper edge of excellent. Google’s internal threshold where spam filters begin to apply mild additional scrutiny. Most well-run programs operate between 0.05 and 0.08 percent.
0.1 percent: the recommended ceiling. Google explicitly recommends staying below 0.1 percent in its bulk sender requirements. Above this number you are not in trouble, but you are also not building reputation; you are spending it.
0.3 percent: the hard threshold. Gmail and Yahoo both formally enforce filtering at this level. Microsoft’s high-volume sender requirements apply similar standards for any domain sending 5,000+ messages daily to Outlook addresses. Crossing 0.3 percent triggers actual filtering decisions, not warnings.
0.5 percent: ESP suspension territory. Most ESPs (Mailchimp, Klaviyo, SendGrid, Smartlead, Instantly) issue formal warnings around 0.2 percent and suspend accounts above 0.5 percent. The mailbox providers are already filtering aggressively at this point; the ESP suspension is the last operational layer before complete sending shutdown.
The pattern matters as much as the rate. Gmail uses a rolling 30 to 60 day window, which means a single bad campaign can hurt your reputation for weeks even if you fix the underlying issue immediately. Worse, the threshold applies per-campaign, not just to the monthly average. A campaign with 0.6 percent complaints can trigger filtering even if your overall monthly rate is 0.15 percent, because Gmail interprets the bad campaign as a signal about your sending judgment regardless of how clean other campaigns were.
Where to actually measure spam complaint rate
The ESP dashboard is the wrong place to look. The four sources that produce the numbers the mailbox providers actually use:
Google Postmaster Tools (primary source for Gmail spam rate). Free, configured per sending domain, shows user-reported spam rate calculated against inbox delivery. This is the canonical source of truth for Gmail complaint rate. Configure it on every sending domain from day one regardless of paid tooling. See the DMARC monitoring guide for the broader Postmaster Tools setup context.
Microsoft SNDS (Smart Network Data Services). Free, IP-based rather than domain-based, shows complaint rate, filter results, and trap hits for Outlook, Hotmail, and Live.com. Less granular than Postmaster Tools but the only direct source for Microsoft data. Required if you send meaningful volume to Microsoft addresses.
Yahoo Complaint Feedback Loop. Yahoo emails individual complaint notifications to a configured feedback loop address. You aggregate them yourself or pipe them to a tool that does. Less convenient than Gmail or Microsoft but still the canonical source for Yahoo.
Paid monitoring layered on top. Folderly, Mailreach, Warmy, and similar tools aggregate complaint data from multiple sources and present unified dashboards. Useful for ongoing operational visibility, especially at scale, but they should layer on top of the official sources rather than replace them.
The discipline that matters: do not trust the ESP number alone. The ESP knows what it sent and what bounced; it does not know how much of the rest reached the inbox versus the spam folder. Only the mailbox providers know that, and only their dashboards give you the spam complaint rate they are actually using to evaluate you.
The five drivers of spam complaints
Not all complaints have the same cause, and the fix depends on which driver is producing the spike. The categorization we use, based on what we see most often across audits:
Driver 1: Relevance failure. Recipient does not recognize the sender, does not see why the message applies to them, or feels the content is off-topic for the relationship they thought they had. Most common driver for B2B cold outreach and for misaligned marketing campaigns. Fix: tighten targeting; improve subject-line-to-body coherence; segment more aggressively.
Driver 2: Frequency fatigue. Recipient is hearing from the sender too often and stops opening with interest. Eventually a frustrated open triggers a spam click. Most common driver for retention marketing programs that ramped from weekly to daily without testing the new cadence. Fix: cap frequency; let engagement signals govern next-send timing; introduce sunset rules for unengaged subscribers.
Driver 3: Intent quality. Recipient did not actually opt in, or opted in for something different. Cold scraped lists, purchased lists, lists from old acquisitions, and ambiguous single-opt-in flows all produce this. Most common driver for cold outreach programs that bought lists or for retention programs that absorbed old acquisitions. Fix: never send to unverified lists; double opt-in for newsletter programs; use list verification before every send.
Driver 4: Unsubscribe friction. Recipient wants to leave but unsubscribe is hidden, multi-step, or appears broken. Marking as spam becomes the easier action. The single most-fixable driver because the fix is one-click unsubscribe as mandated by Google’s bulk sender rules and RFC 8058. Fix: add a prominent one-click unsubscribe header; remove the captcha; honor the request within 48 hours.
Driver 5: List age and engagement decay. Addresses that haven’t engaged in 6 to 12 months convert at lower rates and complain at higher rates as recipients forget the relationship. Most common driver for established programs that never sunset unengaged subscribers. Fix: drop unresponsive contacts after 90 days for cold outbound, 6 months for retention; run reactivation campaigns with clear “still interested?” framing before pruning.
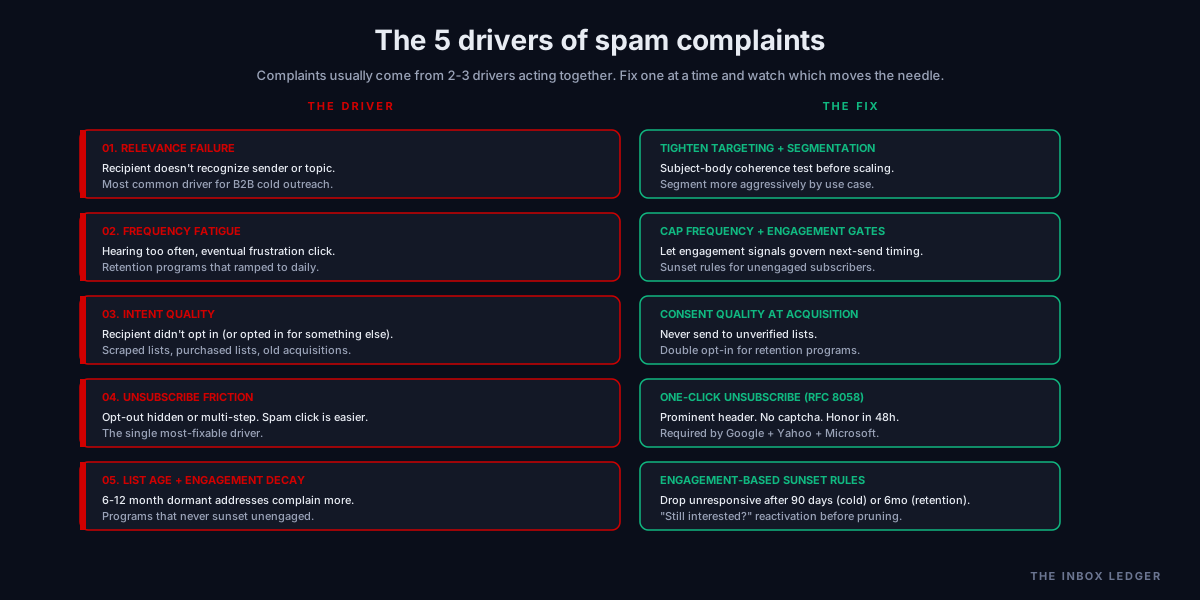
Most teams over-attribute complaints to a single driver. The audit pattern we see is that complaints almost always come from a combination of two or three drivers acting together: cold-acquired addresses (Driver 3) being sent to too frequently (Driver 2) without easy opt-out (Driver 4) eventually complain. Fix one driver at a time and watch which one moves the needle; the answers are often counterintuitive.
The recovery playbook when you are over the threshold
If Postmaster Tools shows you above 0.3 percent (or trending toward it), the next 72 hours determine whether you recover in days or in weeks. The sequence we use:
Hour 0 to 4: Stop the bleeding. Pause all non-critical campaigns immediately. The instinct to “let the next campaign make up for it” is wrong; sending more mail while reputation is dropping accelerates the damage. Critical transactional mail continues; everything else stops until you understand the cause.
Hour 4 to 24: Diagnose the driver. Pull the last 7 to 14 days of campaign data alongside Postmaster Tools data. Look for the specific campaign or campaign type that drove the spike. Match it against the five drivers above. The cause is usually obvious once you align the dates: the reactivation campaign to a 12-month-dormant segment, the daily cadence test, the newsletter absorbed from an acquired company.
Day 1 to 3: Fix the cause. This is not about reducing complaints on future sends; it is about removing the audience or behavior that produced the complaints. If the driver was list quality, suppress everyone who hasn’t engaged in 90 days. If frequency, cut cadence by 50 percent. If unsubscribe friction, implement one-click unsubscribe immediately and reduce the unsubscribe flow to a single button.
Day 3 to 14: Slow restart. Resume sending at 30 to 50 percent of previous volume, to your most engaged segment only (opened or clicked in the last 30 days). Monitor Postmaster Tools daily. If the spam complaint rate drops below 0.1 percent within a week, you are recovering correctly. If it stays elevated, the diagnosis was wrong and you need to re-investigate.
Week 2 to 6: Gradual rebuild. Ramp back to full volume only after 2 consecutive weeks of healthy complaint rates. Add segments back one at a time, starting with most engaged. Sunset unengaged subscribers permanently; the program after the incident should look different from the program before.
The pattern we see on the audits we run is that severe complaint rate damage takes 4 to 6 weeks of disciplined recovery; minor spikes recover in 1 to 2 weeks. The difference is almost entirely how fast the team paused and diagnosed in the first 24 hours. Teams that keep sending while reputation drops typically need twice as long to recover as teams that pause immediately.
For the broader recovery context including blacklist cleanup if complaints triggered listings, see the email blacklist removal guide.
Common spam complaint rate mistakes
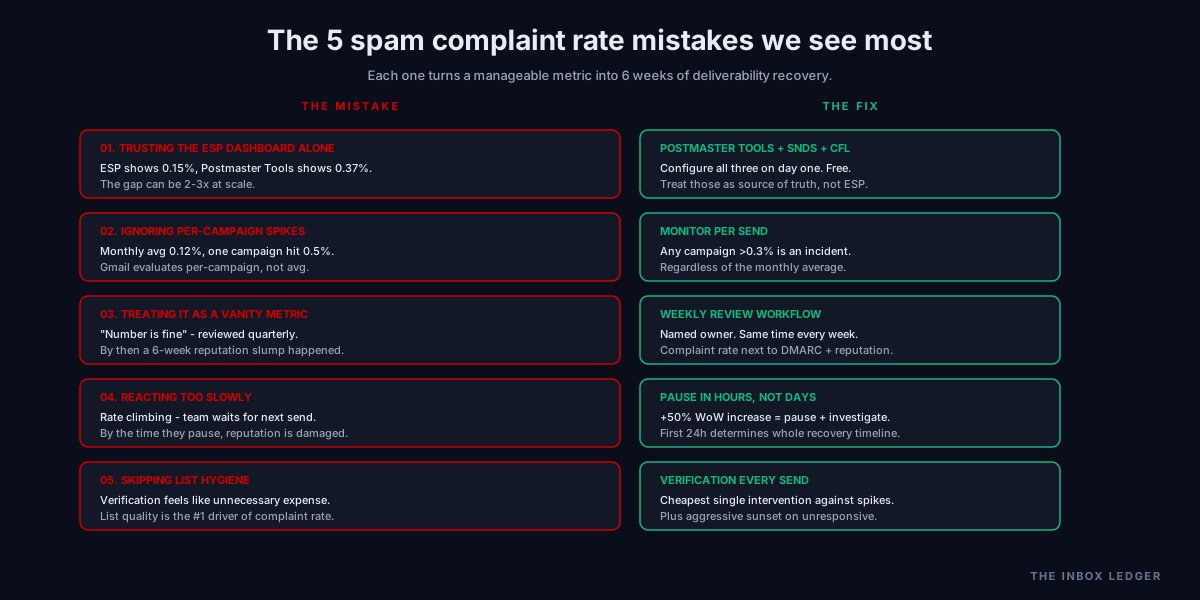
Five patterns we see most often when teams manage spam complaint rate:
1. Trusting the ESP dashboard alone
The denominator trick covered above. ESP dashboards show complaints divided by total sent; mailbox providers calculate complaints divided by inbox delivery. The gap can be 2 to 3x at scale. The fix is configuring Google Postmaster Tools, Microsoft SNDS, and Yahoo CFL from day one and treating those numbers as the source of truth.
2. Ignoring per-campaign spikes
The monthly average is 0.12 percent so the team feels safe, but one campaign hit 0.5 percent and triggered Gmail filtering for the next 60 days. Gmail evaluates per-campaign, not just on rolling averages. The fix is monitoring complaint rate per send and treating any campaign above 0.3 percent as an incident, regardless of the monthly average.
3. Treating spam complaint rate as a vanity metric
The number is fine, the team does not look at it again until the next quarterly review. By then a 6-week reputation slump has already happened. The fix is the weekly triage workflow covered in the DMARC monitoring guide and the email deliverability monitoring vs warmup guide, with complaint rate as one of the dashboards reviewed every week.
4. Reacting too slowly
Postmaster Tools shows the rate climbing; the team waits for the next regular send to “see if it stabilizes.” By the time they pause, reputation is already damaged. The fix is treating any week-over-week complaint rate increase above 50 percent as a signal to pause and investigate, even if the absolute number is still under threshold.
5. Skipping list hygiene
Verification feels like an unnecessary expense until the moment a high-bounce campaign also produces a complaint rate spike. List quality is the single biggest input to complaint rate, more than copy or frequency, because complaints concentrate among recipients who never wanted the mail. The fix is list verification before every send and aggressive sunset rules for unresponsive contacts.
How to keep spam complaint rate low long-term
The prevention discipline that keeps complaint rate consistently below 0.1 percent:
Consent quality at acquisition. Single opt-in is acceptable for B2B if you are sending highly relevant role-based outreach; double opt-in is required for retention newsletter programs. Anything ambiguous (pre-checked boxes, opt-ins buried in terms of service, opt-ins acquired through co-registration) produces elevated complaint rates that no amount of downstream optimization fixes.
One-click unsubscribe everywhere. Required by Google, Yahoo, and Microsoft for bulk senders, but operationally important even at low volume because it converts a spam click into an unsubscribe click. The two actions look the same to recipients but very different to mailbox providers; one damages reputation, the other does not.
Engagement-based segmentation. Recipients engaging in the last 30 days get the regular cadence; recipients dormant 30 to 90 days get a reduced cadence; recipients dormant beyond 90 days get a final reactivation attempt and then sunset permanently. The teams we work with that hold consistently under 0.1 percent complaint rate are almost all running this pattern.
Subject-body coherence. Subject line previews what the message contains; body delivers on the preview. Mismatch (clickbait subjects, misleading personalization) drives a measurable share of complaints. The fix is testing subject-body coherence on a small sample before scaling.
Volume discipline. Sudden volume increases produce complaint rate spikes even from clean lists, because the warming layers (authentication, reputation, list health) take time to absorb new volume. The fix is gradual ramps when scaling and the cold email infrastructure discipline of distributing volume across mailboxes rather than pushing individual mailboxes past safe limits. See also the email warmup tools guide for the warmup side.
Continuous complaint rate monitoring. Postmaster Tools, SNDS, and CFL data reviewed weekly. The teams that stay below 0.1 percent are the ones that look at the number every week, not the ones that look at it when something breaks.
How spam complaint rate fits the broader deliverability stack
The metric is one input to a broader operational discipline:
- Infrastructure (cold email infrastructure guide covers the sending foundation that determines volume safety)
- Authentication (SPF DKIM DMARC setup guide and DMARC policy guide cover the records that prevent spoofing-driven complaint rate inflation)
- List hygiene (email hygiene guide covers the verification discipline that prevents the bulk of complaint rate spikes)
- Warmup (email warmup tools guide covers reputation building that reduces sensitivity to complaint spikes)
- Spam complaint rate (this article: the metric, the math, the drivers, the recovery)
- Sender reputation (sender reputation guide covers the broader reputation layer this metric feeds)
- Deliverability monitoring (email deliverability monitoring vs warmup guide covers the visibility layer this metric lives in)
- DMARC monitoring (DMARC monitoring guide covers the auth-side metric review that complements complaint rate review)
- Recovery (email blacklist removal guide covers what happens when complaint rate damage triggers listings)
The discipline that matters: spam complaint rate is the single highest-signal early warning indicator in the deliverability stack. It moves before opens move, before replies move, and before blacklist listings hit. Teams that monitor it weekly catch problems while they are still small; teams that wait for opens to crater are responding to damage that has already taken weeks to compound. The metric is also one of the cheapest to monitor (Postmaster Tools and SNDS are free) and one of the most actionable (the five drivers map directly to operational fixes), which makes it the highest-leverage attention investment in deliverability operations.
The practical spam complaint rate decision framework
The decision process we use when teams ask how to operate against the metric:
- Configure Postmaster Tools, SNDS, and Yahoo CFL on every sending domain. Free, takes 15 minutes total, non-negotiable baseline
- Stop trusting the ESP dashboard as the source of truth. Compare ESP-reported rate against Postmaster Tools rate weekly; treat the gap as the visibility risk
- Set the operational target at 0.08 percent. Below this, you are building reputation. Above this and approaching 0.1 percent, you are spending it. Above 0.3 percent is a deliverability emergency
- Monitor per-campaign, not just monthly average. Any campaign above 0.3 percent is an incident even if the monthly average is fine
- Diagnose by the five drivers. When the rate moves, identify which driver (relevance, frequency, intent quality, unsubscribe friction, list age) is producing the complaints
- Fix the cause, not the symptom. Reducing send volume temporarily addresses the symptom; suppressing the audience segment that produced the complaints addresses the cause
- Pause fast when the rate climbs. The first 24 hours determine whether recovery takes days or weeks
- Treat list hygiene as the highest-leverage prevention. Verification, double opt-in for retention programs, and engagement-based sunsetting prevent more complaints than any copy optimization
The discipline that separates programs that consistently land in the inbox from programs that fight constant deliverability fires is treating spam complaint rate as the early-warning metric it actually is, measured against the numerator and denominator the mailbox providers actually use, with the recovery playbook ready before the incident.
For the broader operational picture, see the email deliverability pillar, the cold email deliverability checklist, and the how to improve email deliverability walkthrough. For the recovery side, see the email blacklist removal guide and the sender reputation guide.
Frequently asked questions
What is a good spam complaint rate?
How is spam complaint rate calculated?
Why does my ESP show a different complaint rate than Google Postmaster Tools?
How quickly does spam complaint rate damage reputation?
Where can I check my spam complaint rate?
What is the difference between complaint rate threshold for Gmail, Yahoo, and Microsoft?
Can I recover from a high spam complaint rate?
The bottom line on spam complaint rate
Spam complaint rate is the single most-cited and most-misunderstood deliverability metric in 2026. The thresholds are well-known (0.1 percent recommended, 0.3 percent hard limit), the consequences are well-known (filtering, throttling, eventual blocking), and the math is well-known to anyone who reads the bulk sender documentation. What teams consistently miss is that the number their ESP dashboard reports is not the number Gmail uses to evaluate them. The denominator gap between complaints-over-total-sent (what the ESP shows) and complaints-over-delivered-to-inbox (what mailbox providers measure) is where silent reputation damage compounds for weeks before opens start to crater.
The discipline that separates teams that consistently operate under 0.1 percent from teams that fight repeated complaint rate fires is not better copy or more clever segmentation; it is reading Postmaster Tools weekly, treating per-campaign spikes as incidents rather than averaging them away, diagnosing by the five drivers when the rate moves, and pausing fast when something breaks. The metric is free to monitor, costs almost nothing to manage well, and protects more deliverability value than any single piece of paid tooling in the stack. Teams that internalize this stop having reputation problems; teams that keep looking at the wrong number keep getting surprised.
For the broader deliverability operations picture, see the email deliverability pillar, the sender reputation guide, the email deliverability monitoring vs warmup guide, and the email blacklist removal guide. For the prevention side, see the email hygiene guide and the cold email infrastructure guide.
Subscribe to the weekly briefing for operator-grade deliverability and sending notes, one short email every week.
More on Deliverability
Email blacklist removal 2026: the operator playbook
Email blacklist removal in 2026: diagnose the root cause first, identify the tier, delist in the right order, prevent re-listing. The full playbook.
Email deliverability monitoring vs warmup: 2026 guide
Email deliverability monitoring vs warmup in 2026: what each does, when you need both, and why monitoring is non-negotiable post-enforcement.
DMARC policy: when to move from p=none to quarantine
DMARC policy in 2026: when to move from p=none to quarantine to reject, how to read dmarc reports, and what to avoid breaking on the way there.